January 2011 Edition
Computer Science Department, University of Cape Town
| MIT Notes Home | Edition Home |
| MSc-IT Study Material January 2011 Edition Computer Science Department, University of Cape Town | MIT Notes Home | Edition Home | |
Data-flow diagrams (DFDs) model a perspective of the system that is most readily understood by users – the flow of information through the system and the activities that process this information.
Data-flow diagrams provide a graphical representation of the system that aims to be accessible to computer specialist and non-specialist users alike. The models enable software engineers, customers and users to work together effectively during the analysis and specification of requirements. Although this means that our customers are required to understand the modeling techniques and constructs, in data-flow modeling only a limited set of constructs are used, and the rules applied are designed to be simple and easy to follow. These same rules and constructs apply to all data-flow diagrams (i.e., for each of the different software process activities in which DFDs can be used).
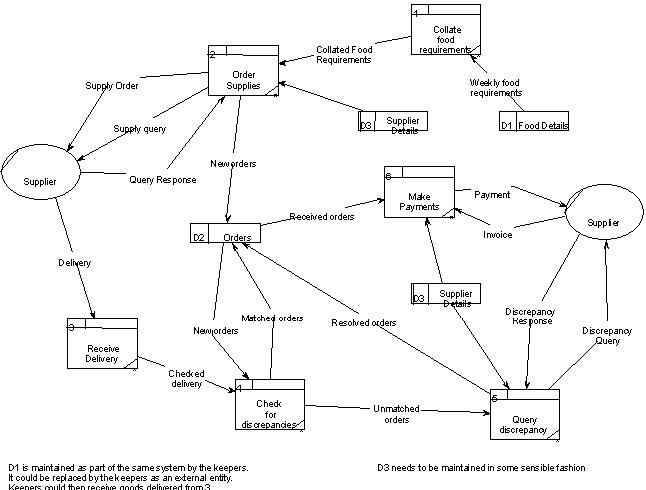
An example of part of a data-flow diagram is given below. Do not worry about which parts of what system this diagram is describing – look at the diagram to get a feel for the symbols and notation of a data-flow diagram.
As can be seen, the DFD notation consists of only four main symbols:
Processes — the activities carried out by the system which use and transform information. Processes are notated as rectangles with three parts, such as “Order Supplies” and “Make Payments” in the above example.
Data-flows — the data inputs to and outputs from to these activities. Data-flows are notated as named arrows, such as “Delivery” and “Supply Order” in the example above.
External entities — the sources from which information flows into the system and the recipients of information leaving the system. External entities are notated as ovals, such as “Supplier” in the example above.
Data stores — where information is stored within the system. Data stores are notated as rectangles with two parts, such as “Supplier Details” and “Orders” in the example above.
The diagrams are supplemented by supporting documentation including a data dictionary, describing the contents of data-flows and data stores; and process definitions, which provide detailed descriptions of the processes identified in the data-flow diagram.
Data-flow diagrams provide a very important tool for software engineering, for a number of reasons:
The system scope and boundaries are clearly indicated on the diagrams (more will be described about the boundaries of systems and each DFD later in this chapter).
The technique of decomposition of high level data-flow diagrams to a set of more detailed diagrams, provides an overall view of the complete system, as well as a more detailed breakdown and description of individual activities, where this is appropriate, for clarification and understanding.
Use-case diagrams also provide a partition of a software-system into those things which are inside the system and those things which are outside of the system.