January 2011 Edition
Computer Science Department, University of Cape Town
| MIT Notes Home | Edition Home |
| MSc-IT Study Material January 2011 Edition Computer Science Department, University of Cape Town | MIT Notes Home | Edition Home | |
Having discussed both what models are and what we expect of them, we will now introduce the models that you will be studying in the following chapters. This section is meant as an overview, so do not worry if you do not understand something. You will be introduced to each type of model in far more detail in one of the next units.
There are three key aspects which need to be considered when attempting to understand a software system:
the data needed in the system,
the processes or functions which the system performs
what events occur and what changes are made over time
It is useful, therefore, to have a different modelling techniques to focus on each of these areas. Three corresponding modelling techniques are:
Class models
Data-flow diagrams
Sequence diagrams
Each of these modelling techniques is a diagram-based technique with accompanying text (either on the diagram, or to supplement the diagram).
The example models presented in the following three sections have been constructed for a particular software system example. The example system is that of an estate agent that organises the buying and selling of houses. Each of the diagrams will represent a different aspect of this system.
A class model is used to represent the data structure of a system. In other words, the focus of this model is the data needed in the system. The data is represented as classes and relationships between classes.
An example class model is given in Figure 4.1, “An example class model of an estate agency”.
Although no details about class models have been given, it should already be possible for you to understand parts of the diagram — for example, that boxes correspond to classes such as “Client” and “Property”, and the lines represent relationships between them. Class models are a very important modelling technique, since the data and relationships of a system are least likely to change significantly. These diagrams are often constructed early on, and the other models built up from them.
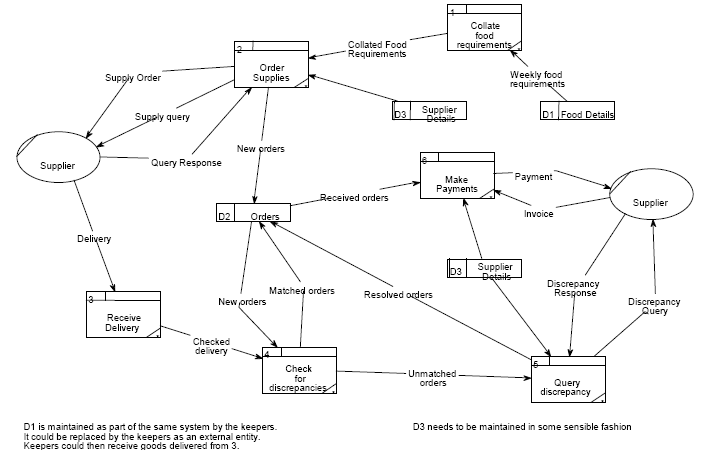
Data-flow diagrams (DFD) represent the processes or functions which the system performs, and how data flows between processes and in and out of the system. See Figure 4.2, “An example of a data-flow diagram”.
Data-flow diagrams represent a somewhat more complicated modelling technique than class models. The named boxes are processes representing actions; the named arrows represent data moving between the processes. Some boxes represent data stores where data flows either to or from. The bubbles are external entities that provide data to the system and receive the output data.
This single diagram does not demonstrate an important feature of data-flow diagrams — their hierarchical organisation. Complex processes (such as “2 Order Supplies”) can be iteratively broken into separate processes until the entire system has been described in full detail. Do not worry about the complexities of data-flow diagrams, you will learn the details of this technique in Chapter 6, Data-Flow Diagrams.
A sequence diagram shows how instances of various classes (taken from, say, a class model) interact with each other over time.
The diagram should be read from top to bottom, which is the direction in which time progresses. The boxes represent not classes, but objects (which is notated using the colons in front of the class names).
All three models represent the same system, albeit different aspects of that system. This is in the same way that a drawing of a human skeleton (a “bone” model) and a model of human musculature differ from one another, but still both represent the human body.
Class diagrams, data-flow diagrams, and sequence diagrams, must relate to each other and be consistent with one another. Though they represent different things, there is a correlation between the various parts of the different diagrams. If these parts do not match up when the diagrams have been completed then it is a sign that either something has been omitted from (at least) one of the diagrams, or that they are not correct. You will learn about the relationships between the different kinds of diagrams in later chapters.
With regards to producing these diagrams for a particular software system, remember that there is no “correct” version of these models. Two different systems analysts may look at the same system and produce two different models. This is almost to be expected, since people approach the analysis of a software system from their own previous experience and, in some sense, their individual perspective gets built into the system.
Just because there is no “correct” model does not mean that all models are equally valid or equally useful. In most cases it takes many attempts to produce a “good” model. The first things written down when developing a model merely act as somewhere to start. As the model is built up the analyst's knowledge of the system increases and they may realise that some details have been omitted or that the original structure is unsuitable or unfeasible. Analysts must be prepared to insert new details, re-draw existing parts of the diagram and even, on occasion, throw away the current model and begin anew.
Class and sequence diagrams will be drawn using the UML. The above diagrams were drawn using the Umbrello software package, although other packages exist. You may want to explore:
The SSADM notation is used for data-flow diagrams (since this is not a part of the UML). The freely available Dia package provides support for data-flow diagrams.